Visualizing the connection graphs
iSore allows to easily visualize the connection graphs using the HDF5 browser provided with the software and pymol. First the connections graphs must be stored in a HDF5 file. To do that simply generate the graphs as following:
>>> from iScore.graphrank.graph import iscore_graph
>>> iscore_graph(pdb_path=<pdb_path>,
>>>              pssm_path=<pssm_path>,
>>>              export_hdf5=True)
where you have to specify the folder containing the PDB files abd PSSM files in pdb_path and pssm_path. By default this are simply ./pdb/ and ./pssm/. The script above will create a HDF5 file containing the graph.
This HDF5 cile can be explored using the the dedicated HDF5 browser. Go to the ./h5x/ folder and type:
./h5x.py
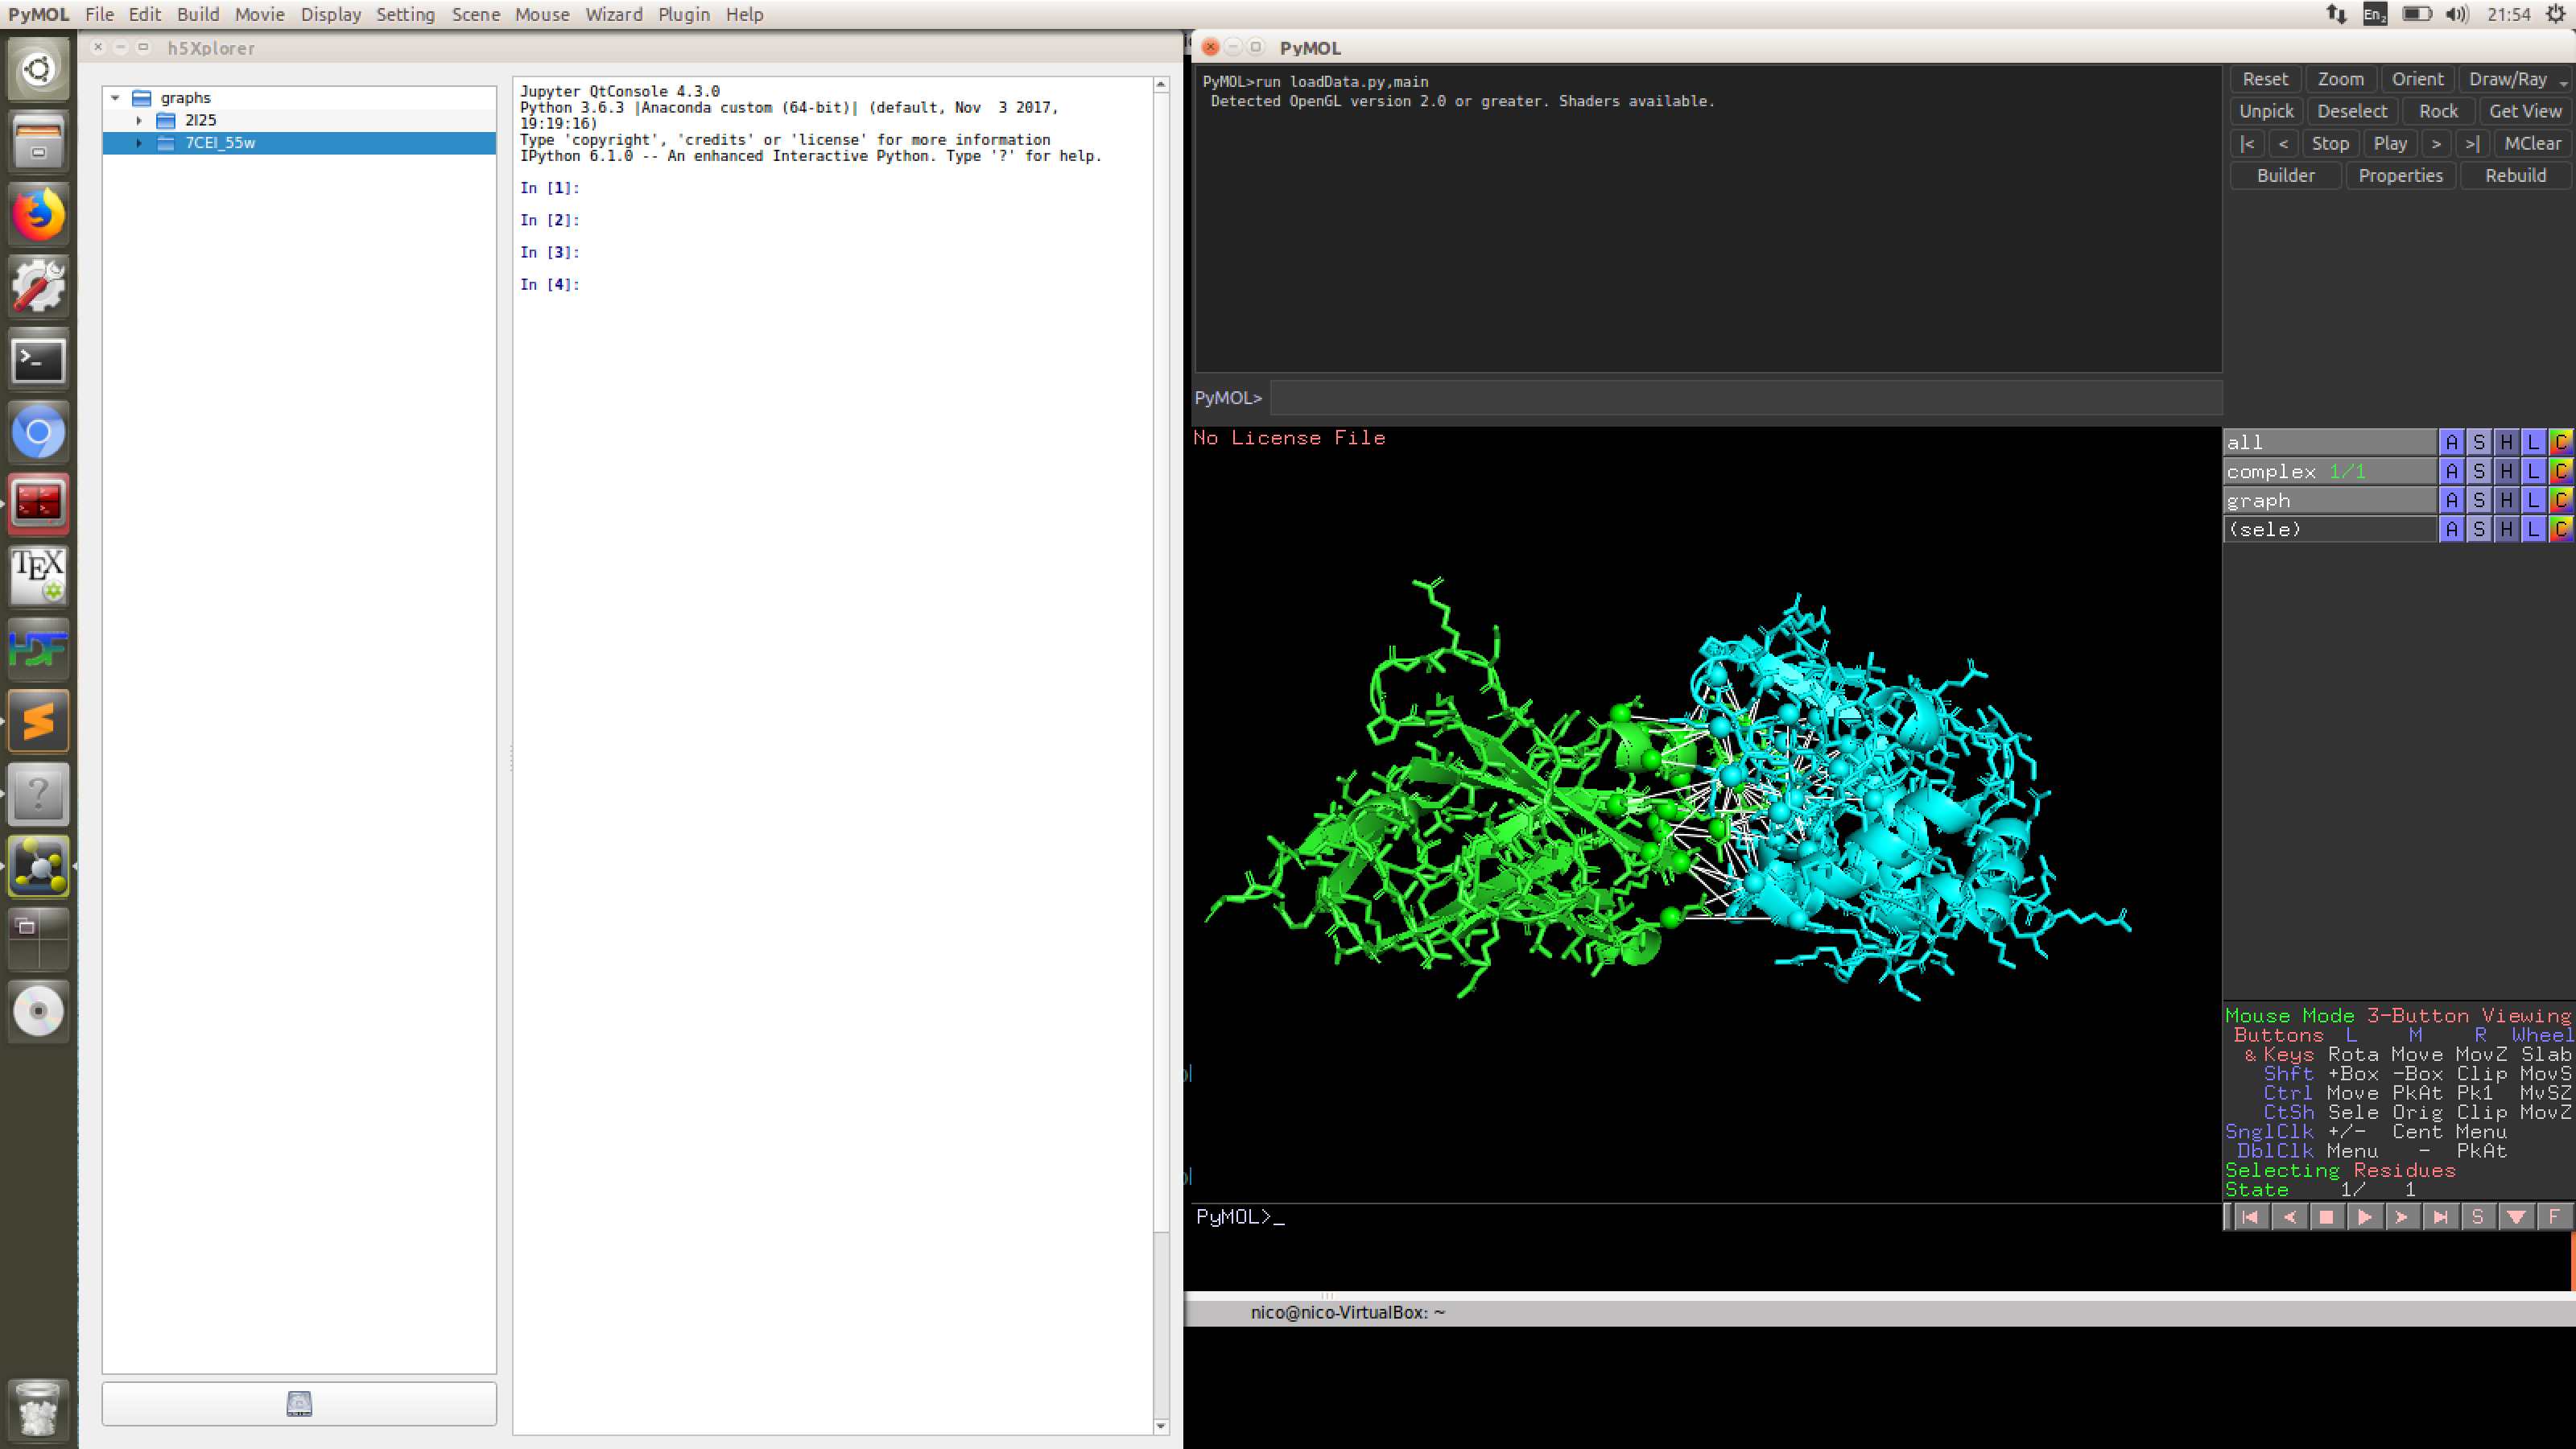
This will open the hdf5 browser. You can open a hdf5 file by clicking on the file icon in the bottom left of the browser. Once opened, you will see the content of the file in the browser. Right-click on the name of a conformation and choose 3D Plot. This will open PyMol and allow you to visualize the connecton graph